
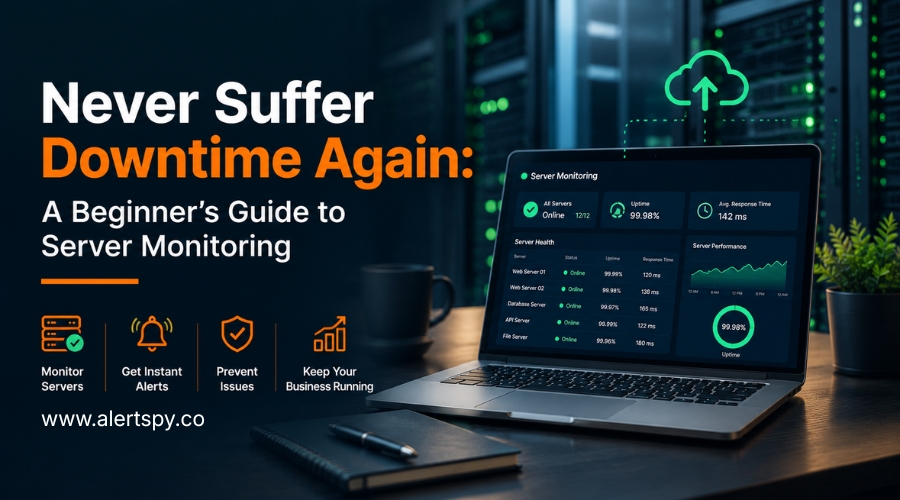
A server can look quiet from the outside while memory fills up, disk space disappears, or response times start drifting upward. If no one is watching those signals, the first alert may come from a customer who cannot check out, log in, or reach your support team.
Server monitoring is the practice of continuously checking server health, performance, availability, and security signals. Good server monitoring software turns those signals into useful alerts before a small issue becomes a costly outage.
TL;DR
- Server monitoring tracks CPU, memory, disk, network, uptime, response time, and error trends across important infrastructure.
- The goal is not just to know whether a server is up. The goal is to spot unhealthy behavior early enough to act.
- Different server types need different checks. Web servers, databases, email servers, DNS servers, and file servers fail in different ways.
- Smart thresholds, historical trends, and focused alert routing help teams avoid alert fatigue.
- AlertSpy helps teams monitor websites, ping checks, ports, SSL, domains, and other critical services from one simple dashboard.
What is server monitoring, really?
A server is a computer that runs in the background for your website, app, database, email, DNS, internal tools, or customer-facing services. Server monitoring watches that machine's vital signs so your team can understand whether it is healthy.
At a basic level, monitoring answers simple questions: Is the server reachable? Is it responding quickly? Does it have enough CPU, memory, and disk space? Are error rates rising? Are important ports and services still available?
Why server monitoring matters
- It reduces downtime risk. You can catch full disks, resource pressure, stopped services, and failed dependencies before they take down the customer experience.
- It protects revenue and leads. A slow or unavailable server can block checkout, signup forms, booking flows, API requests, and paid landing pages.
- It improves troubleshooting. Historical metrics show what changed before the incident started, which is often more useful than staring at the current state alone.
- It supports better customer communication. When monitoring confirms a real outage, your team can update a status page or notify customers with confidence.
How server monitoring tools collect data
Most monitoring setups use one or more of these approaches:
Agent-based monitoring
An agent runs directly on the server and reports detailed local metrics such as CPU, memory, disk, running processes, and logs. This gives deeper visibility, but it requires installation and ongoing maintenance.
Agentless monitoring
Agentless checks inspect the server from outside using protocols, ports, ping checks, HTTP checks, or network requests. This is lighter to deploy and useful for broad coverage, but it may not expose every internal metric.
Hybrid monitoring
Many teams use both. Deep checks go on the most critical servers, while lighter external checks cover availability, response time, and network reachability across the wider estate.
Which server metrics should you monitor?
| Metric | What it tells you | Warning sign |
|---|---|---|
| CPU usage | How hard the processor is working. | Sustained high usage or unusual spikes. |
| Memory usage | How much RAM the server is consuming. | Regular pressure, swapping, or steady growth. |
| Disk usage | How much storage remains. | Disk approaching full capacity. |
| Disk I/O | How fast storage reads and writes complete. | Rising latency or queue depth. |
| Network traffic | How much data moves in and out. | Unexpected spikes, saturation, or packet loss. |
| Response time | How quickly the server answers requests. | Slow responses during normal traffic. |
| Uptime | Whether the server or service is reachable. | Failed checks or repeated restarts. |
| Error rate | How many requests fail or time out. | Any upward trend on critical services. |
Monitoring priorities by server type
- Web servers: response time, active connections, HTTP status codes, SSL expiry, and availability.
- Database servers: query time, connection count, replication lag, storage, and CPU.
- Application servers: memory growth, thread counts, service uptime, errors, and dependency failures.
- File servers: storage capacity, disk I/O, permissions, and unusual transfer activity.
- Email servers: delivery failures, bounce rates, queue growth, and mailbox capacity.
- DNS servers: query response time, failed lookups, and record availability.
Server monitoring best practices
- Document your setup. Keep a simple inventory of servers, owners, services, dependencies, and the checks attached to each one.
- Start with the essentials. Monitor CPU, memory, disk, response time, uptime, network, and the customer-facing services that matter most.
- Set realistic thresholds. Watch normal behavior first, then alert on meaningful deviations instead of every tiny spike.
- Route alerts carefully. Send critical incidents to urgent channels and lower-priority warnings to places your team reviews on a regular schedule.
- Review trends regularly. Monitoring is most useful when it shows slow changes before they become outages.
- Keep backups and access controls current. Monitoring helps you detect problems, but recovery still depends on backups, patching, permissions, and a clear incident process.
Server monitoring vs. network monitoring vs. APM
| Practice | Focus | Example use |
|---|---|---|
| Server monitoring | CPU, memory, disk, processes, ports, and server uptime. | Finding high CPU usage or low disk space before failure. |
| Network monitoring | Routers, switches, bandwidth, packet loss, and connectivity. | Detecting congestion or a failing network path. |
| APM | Application code, traces, errors, and transaction speed. | Finding which endpoint or dependency makes a request slow. |
| Observability | Metrics, logs, traces, and events across the full system. | Understanding why an incident happened across many services. |
Signs you need better monitoring now
- Customers usually tell you about outages before your own systems do.
- No one can describe normal CPU, memory, or response-time behavior.
- You have had a surprise full disk, crashed service, or expired SSL certificate.
- Your only process is manually checking dashboards when someone remembers.
- You have no timeline of what happened before the last outage.
Common beginner mistakes
- Alerting on everything. Too many low-value alerts train people to ignore the channel.
- Monitoring only uptime. A server can be technically up while the experience is painfully slow or partially broken.
- Ignoring historical data. Trends often reveal tomorrow's outage before a hard failure occurs.
- Using disconnected tools. Five dashboards that do not agree can slow down incident response.
- Setting and forgetting. Thresholds that made sense last year may be wrong after traffic, infrastructure, or customer behavior changes.
A simple 5-step server monitoring plan
- List and prioritize servers. Start with the systems that affect revenue, login, checkout, support, or customer access.
- Choose key metrics. Begin with CPU, memory, disk, uptime, response time, and service availability.
- Set useful thresholds. Base alerts on normal behavior, not generic numbers alone.
- Pick alert channels. Route urgent issues to channels people actually watch.
- Review and improve. Tune noisy checks, add missing coverage, and use incident history to make the next response faster.
Monitor critical services with AlertSpy
AlertSpy helps teams watch the systems that keep a business online. Use website monitoring for public pages, ping monitoring for reachability, and port monitoring for important services such as web, database, mail, and custom app ports.
The practical goal is simple: know when something important is drifting, failing, or unavailable before users have to report it for you.
FAQ
-
What are the benefits of server monitoring?
Server monitoring gives your team visibility into server health, performance, uptime, and early warning signs so you can respond before problems spread. -
Can server monitoring prevent downtime?
It cannot prevent every outage, but it helps you detect the conditions that often lead to downtime, such as overloaded resources, stopped services, or unreachable ports. -
What should I look for in a server monitoring tool?
Look for real-time checks, useful alerts, historical data, a clear dashboard, multiple notification channels, and support for the services your business depends on. -
What is the difference between server and network
monitoring?
Server monitoring focuses on individual servers and services. Network monitoring focuses on connectivity, bandwidth, routers, switches, packet loss, and network paths.